We use Key Performance Indicators (KPIs) to assess performance in meeting our strategic and operating objectives.
Performance is measured against the following financial, operating and sustainability KPIs:
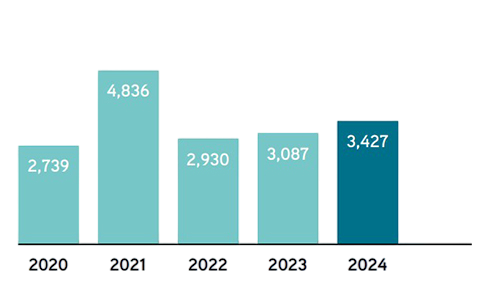
$3,427m
Why it is important
This is a measure of our underlying profitability
Performance in 2024
EBITDA was $3.4 billion, 11% higher on stronger revenues and robust cost control, which helped to increase the Group’s EBITDA margin to 52% (2023: 49%)
*1. Non-IFRS measures, refer to the alternative performance measures.
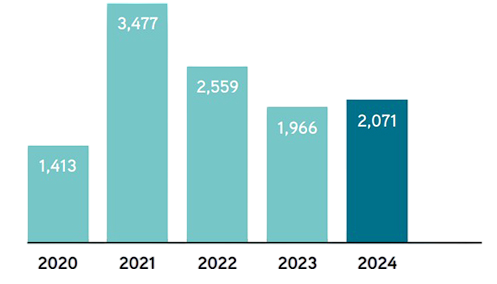
$2,071m
Why it is important
This is a measure of our profitability before the deduction of taxes.
Performance in 2024
Profit before tax (including exceptional items) was $2,071 million, 5% higher than 2023 due to higher revenues (higher copper price); the exceptional items gain mainly related to impairment reversal in Antucoya, partly offset by higher depreciation and amortisation
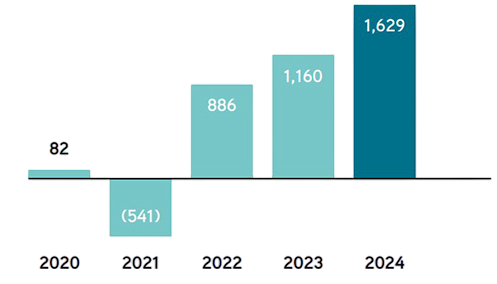
$1,160m
Why it is important
This measure reflects our financial liquidity.
Performance in 2024
Profit before tax (including exceptional items) was $2,071 million, 5% higher than 2023 due to higher revenues (higher copper price); the exceptional items gain mainly related to impairment reversal in Antucoya, partly offset by higher depreciation and amortisation.
*1. Non-IFRS measures, refer to the alternative performance measures.
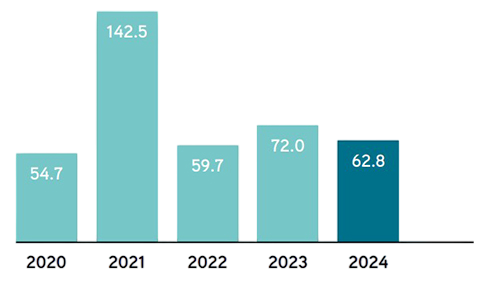
$62.8.0¢
Why it is important
These are measures of the profit attributable to shareholders before exceptional items.
Performance in 2024
Underlying earnings per share excluding exceptional items decreased by 13% to 62.8 cents, reflecting lower underlying profit after tax.
*2. From continuing operations excluding exceptional items.
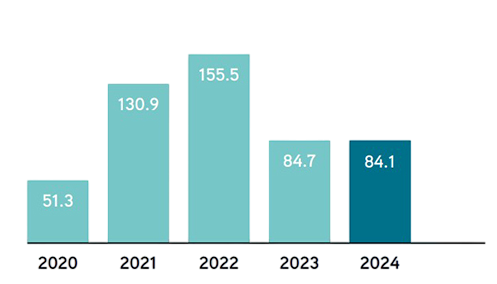
$84.1¢
Why it is important
These are measures of the profit attributable to shareholders after exceptional items.
Performance in 2024
Earnings per share including exceptional items for the year were 1% lower at 84.1 cents, compared with 2023, despite the higher profit after tax during the year.
*3. From continuing and discontinued operations including exceptional items.
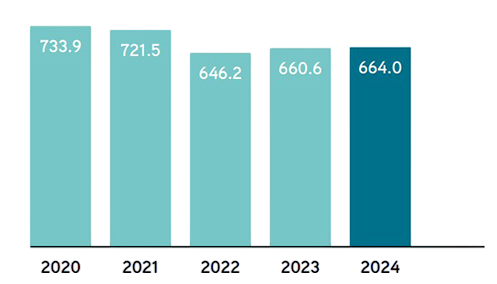
664.0 kt
Why it is important
Copper is our main product and largest source of revenue.
Performance in 2024
Copper production increased by 1% to 664,000 tonnes, with higher production at Centinela Cathodes and Los Pelambres, offset by lower grades at Centinela Concentrates.
*5. 100% of Los Pelambres, Centinela and Antucoya, and 50% of Zaldívar’s production.
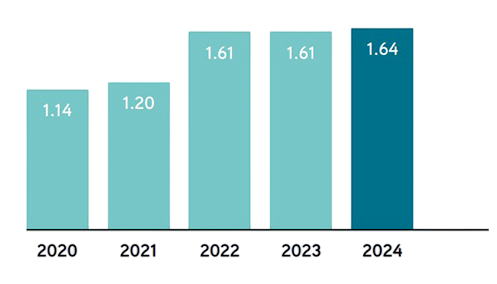
$1.64/lb
Why it is important
This is a key indicator of operating efficiency and profitability.
Performance in 2024
Net cash costs for 2024 were $1.64/lb, in line with 2023 and guidance for the year, reflecting lower copper grades at Los Pelambres offset by stronger by-product credits
*1. Non-IFRS measures, refer to the alternative performance measures.
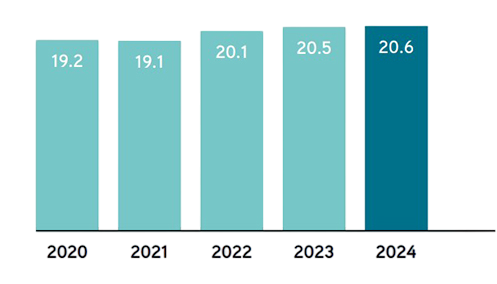
20.6bn tonnes
Why it is important
Our mineral resource base supports our strong organic growth pipeline.
Performance in 2024
Total mineral resources increased by 148 million tonnes during the year, following work at Centinela.
*6. Mineral resources (including ore reserves) relating to the Group’s subsidiaries on a 100% basis and Zaldívar on a 50% basis.
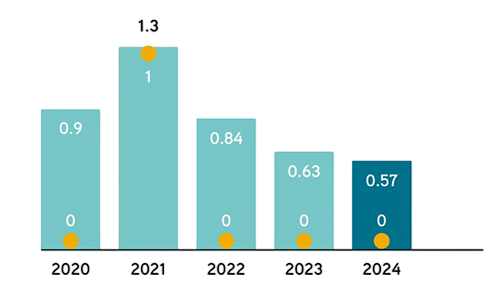
0 Fatalities
0.57 LTIFR*
Why it is important
Safety is our top priority, with fatalities and the LTIFR** being two of our principal measures of performance.
Performance in 2024
Record safety performance with no fatalities and the LTIFR improving by a further 9% as the Group continues to embed a safety-first culture, with improvements in both leading and lagging indicators of safety.
**7. The Lost Time Injury Frequency Rate is the number of accidents with lost time during the year per million hours worked.
103 GL
Why it is important
Water is a precious resource and we are focused on using the most sustainable sources and maximising its efficient use.
Performance in 2024
The use of sea water as a proportion of total water withdrawals was similar on a year on year basis at 58% (2023: 60%). Increase in overall water use reflects the Group’s increase in ore processing in 2024.
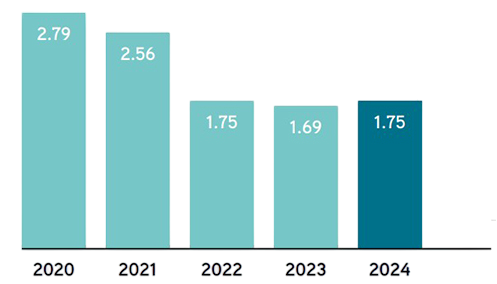
1.75 tC02e/tCu
Why it is important
We recognise the risks and opportunities arising from climate change and the need to measure and mitigate greenhouse gas (GHG) emissions.
Performance in 2024
CO2e emissions intensity increased by 3% in 2024.
*8. Scope 1 and 2, Mining division only.
*9. Tonnes of CO2 equivalent per tonne of copper produced.